a. When weekly exercise time is 460 minutes (approximately 66 minutes per day), the 95 percent confidence interval for change in cholesterol level is (197.3, 225.4). This means that
i. If one person exercises 460 minutes per week, his/hers change in cholesterol level will be between 197.3 and 225.4 with 95 percent certainty.
ii. If several people exercise 460 minutes per week, their average change in cholesterol level will be between 197.3 and 225.4 with 95 percent certainty.
b. When weekly exercise time is 460 minutes (approximately 66 minutes per day), the 95 percent prediction interval for change in cholesterol level is (155.1, 267.6). This means that
i. If one person exercises 460 minutes per week, his/hers change in cholesterol level will be between 155.1 and 267.6 with 95 percent certainty.
ii. If several people exercise 460 minutes per week, their average change in cholesterol level will be between 155.1 and 267.6 with 95 percent certainty.
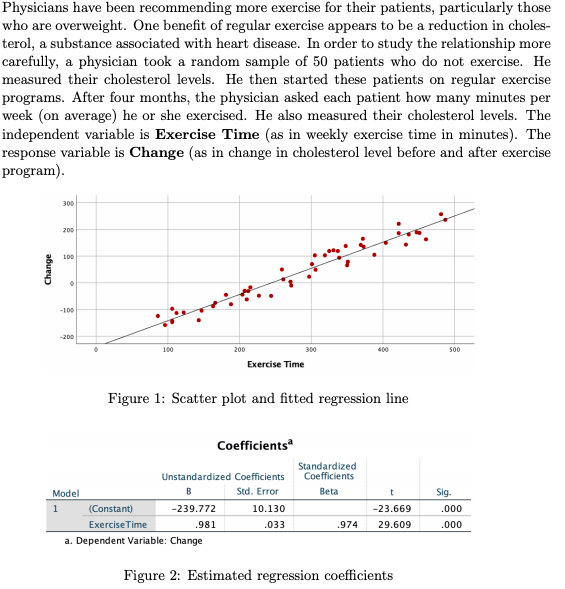
Extracted text: Physicians have been recommending more exercise for their patients, particularly those who are overweight. One benefit of regular exercise appears to be a reduction in choles- terol, a substance associated with heart disease. In order to study the relationship more carefully, a physician took a random sample of 50 patients who do not exercise. He measured their cholesterol levels. He then started these patients on regular exercise programs. After four months, the physician asked each patient how many minutes per week (on average) he or she exercised. He also measured their cholesterol levels. The independent variable is Exercise Time (as in weekly exercise time in minutes). The response variable is Change (as in change in cholesterol level before and after exercise program). 300 200 100 -100 -200 100 200 300 400 500 Exercise Time Figure 1: Scatter plot and fitted regression line Coefficients Standardized Coefficients Unstandardized Coefficients Model B Std. Error Beta Sig. 1 (Constant) -239.772 10.130 -23.669 .000 ExerciseTime .981 .033 .974 29.609 .000 a. Dependent Variable: Change Figure 2: Estimated regression coefficients Change

Extracted text: ANOVA Sum of Squares Model df Mean Square Sig. 1 Regression 642950.535 642950.535 .000 1 876.722 Residual 35201.145 48 733.357 Total 678151.680 49 a. Dependent Variable: Change b. Predictors: (Constant), ExerciseTime Figure 3: Analysis of Variance