Chapter 8 Risk and Rates of Return 313 a . Why is the T-bill's return independent of the state of the economy? Do T-bills promise a completely risk-free return? Explain. Why are High Tech's returns...


part f 1,2


Chapter 8 Risk and Rates of Return<br>313<br>a<br>. Why is the T-bill's return independent of the state of the economy? Do T-bills promise a completely<br>risk-free return? Explain.<br>Why are High Tech's returns expected to move with the economy, whereas Collections'e are<br>expected to move counter to the economy?<br>previous table<br>u should recognize that basing a decision solely on expected returns is appropriate only for risk-<br>10 nal individuals. Because your client, like most people, is risk-averse, the riskiness of each alter-<br>tative is an important aspect of the decision. One possible measure of risk is the standard deviation<br>of returns.<br>1 Calgulate this value for each alternative and fill in the blank on the row for o in the table.<br>2. What type of risk is measured by the standard deviation?<br>3 Draw a graph that shows roughly the shape of the probability distributions for High Tech, U.S.<br>Rubber, and T-bills.<br>å Suppose you suddenly remembered that the coefficient of variation (CV) is generally regarded as<br>r a better measure of stand-alone risk than the standard deviation when the alternatives being<br>onsidered have widely differing expected returns. Calculate the missing CVs, and fill in the blanks<br>n the row for CV in the table. Does the CV produce the same risk rankings as the standard devia-<br>tion? Explain.<br>Someone mentioned that you might also want to calculate the Sharpe ratio as a measure of stand-<br>alone risk. Calculate the missing ratios and fill in the blanks on the row for the Sharpe ratio in the<br>table. Briefly explain what the Sharpe ratio actually measures.<br>f Suppose you created a two-stock portfolio by investing $50,000 in High Tech and $50.000 in<br>Collections.<br>1. Calculate the expected return (f), the standard deviation (o), the coefficient of variation (CV,),<br>and the Sharpe ratio for this portfolio, and fill in the appropriate blanks in the table.<br>2 How doss the riskiness of this two-stock portfolio compare with the riskiness of the individual<br>stocks if they were held in isolation?<br>g. Suppose an investor starts with a portfolio consisting of ane randomly selected stock.<br>1. What would happen to the riskiness and to the expected retum of the portfolio as more randomly<br>selected stocks were added to the portfolio?<br>2 What is the implication for investors? Draw a graph of the two portfolios to illustrate your<br>answer.<br>h 1. Should the effects of a portfolio impact the way investors think about the riskiness of individual<br>stocks?<br>2 If you decided to hold a one-stock portfolio (and consequently were exposed to more risk than<br>diversified investors), could you expect to be compensated for all of your risk; that is, could you<br>earn a risk premium on the part of your risk that you could have eliminated by diversifying?<br>1 The expected rates of retum and the beta coefficients of the alternatives supplied by an independen:<br>analyst are as follows:<br>Security<br>1.31<br>High Tech<br>%66<br>00 0<br>0.88<br>Market<br>7.3<br>U.S. Rubber<br>000<br>(0.50)<br>T-bills<br>1.2<br>Collections<br>

Extracted text: Chapter 8 Risk and Rates of Return 313 a . Why is the T-bill's return independent of the state of the economy? Do T-bills promise a completely risk-free return? Explain. Why are High Tech's returns expected to move with the economy, whereas Collections'e are expected to move counter to the economy? previous table u should recognize that basing a decision solely on expected returns is appropriate only for risk- 10 nal individuals. Because your client, like most people, is risk-averse, the riskiness of each alter- tative is an important aspect of the decision. One possible measure of risk is the standard deviation of returns. 1 Calgulate this value for each alternative and fill in the blank on the row for o in the table. 2. What type of risk is measured by the standard deviation? 3 Draw a graph that shows roughly the shape of the probability distributions for High Tech, U.S. Rubber, and T-bills. å Suppose you suddenly remembered that the coefficient of variation (CV) is generally regarded as r a better measure of stand-alone risk than the standard deviation when the alternatives being onsidered have widely differing expected returns. Calculate the missing CVs, and fill in the blanks n the row for CV in the table. Does the CV produce the same risk rankings as the standard devia- tion? Explain. Someone mentioned that you might also want to calculate the Sharpe ratio as a measure of stand- alone risk. Calculate the missing ratios and fill in the blanks on the row for the Sharpe ratio in the table. Briefly explain what the Sharpe ratio actually measures. f Suppose you created a two-stock portfolio by investing $50,000 in High Tech and $50.000 in Collections. 1. Calculate the expected return (f), the standard deviation (o), the coefficient of variation (CV,), and the Sharpe ratio for this portfolio, and fill in the appropriate blanks in the table. 2 How doss the riskiness of this two-stock portfolio compare with the riskiness of the individual stocks if they were held in isolation? g. Suppose an investor starts with a portfolio consisting of ane randomly selected stock. 1. What would happen to the riskiness and to the expected retum of the portfolio as more randomly selected stocks were added to the portfolio? 2 What is the implication for investors? Draw a graph of the two portfolios to illustrate your answer. h 1. Should the effects of a portfolio impact the way investors think about the riskiness of individual stocks? 2 If you decided to hold a one-stock portfolio (and consequently were exposed to more risk than diversified investors), could you expect to be compensated for all of your risk; that is, could you earn a risk premium on the part of your risk that you could have eliminated by diversifying? 1 The expected rates of retum and the beta coefficients of the alternatives supplied by an independen: analyst are as follows: Security 1.31 High Tech %66 00 0 0.88 Market 7.3 U.S. Rubber 000 (0.50) T-bills 1.2 Collections
百<br>Bartman, of Stock A, of Stock B, and 20% of C.<br>would the beta and return be?<br>a job as a with a Your f<br>RISK AND RETURN that you a major in just lande<br>end of 1 you have been to plan for a bossla<br>assignment is to a client. the are to be in a a<br>and (For now, the items at of you will fill it<br>bar<br>the SML equation<br>h If you formed a portfolio that cons<br>restricted you to the in the with their probablite<br>i an to stock in his portfolio.<br>Reynolds, what<br>pue c86<br>INTEGRATED CASE<br>MERRILL FINCH INC.<br>8-23<br>a job as a financial planner with Merrill Finch Inc., a large<br>a<br>restricted<br>nou,<br>blanks later.)<br>Returns on Alternative Investments<br>Estimated Rate of Retum<br>U.S.<br>Rubber<br>Market<br>State of the<br>Probability T-Bills<br>Collections<br>Portfolio<br>Portfollo<br>AsOucog<br>24.5%<br>Recession<br>0.1<br>(29.5%)<br>(195%)<br>10.5<br>(16.5)<br>(5.5)<br>(5)<br>125<br>0.2<br>0.4<br>3.0<br>0.5<br>7.5<br>(0')<br>Above average<br>0.2<br>3.0<br>27.5<br>38.5<br>225<br>(O'S)<br>0.1<br>42.5<br>23.5<br>35.5<br>113<br>woog<br>3.0<br>997.<br>1.2%<br>7.3%<br>112<br>18.8<br>15.2<br>00<br>9.8<br>2.6<br>Sharpe ratio<br>-0.16<br>50<br>-0.50<br>0.88<br>1000<br>13<br>1.00<br>

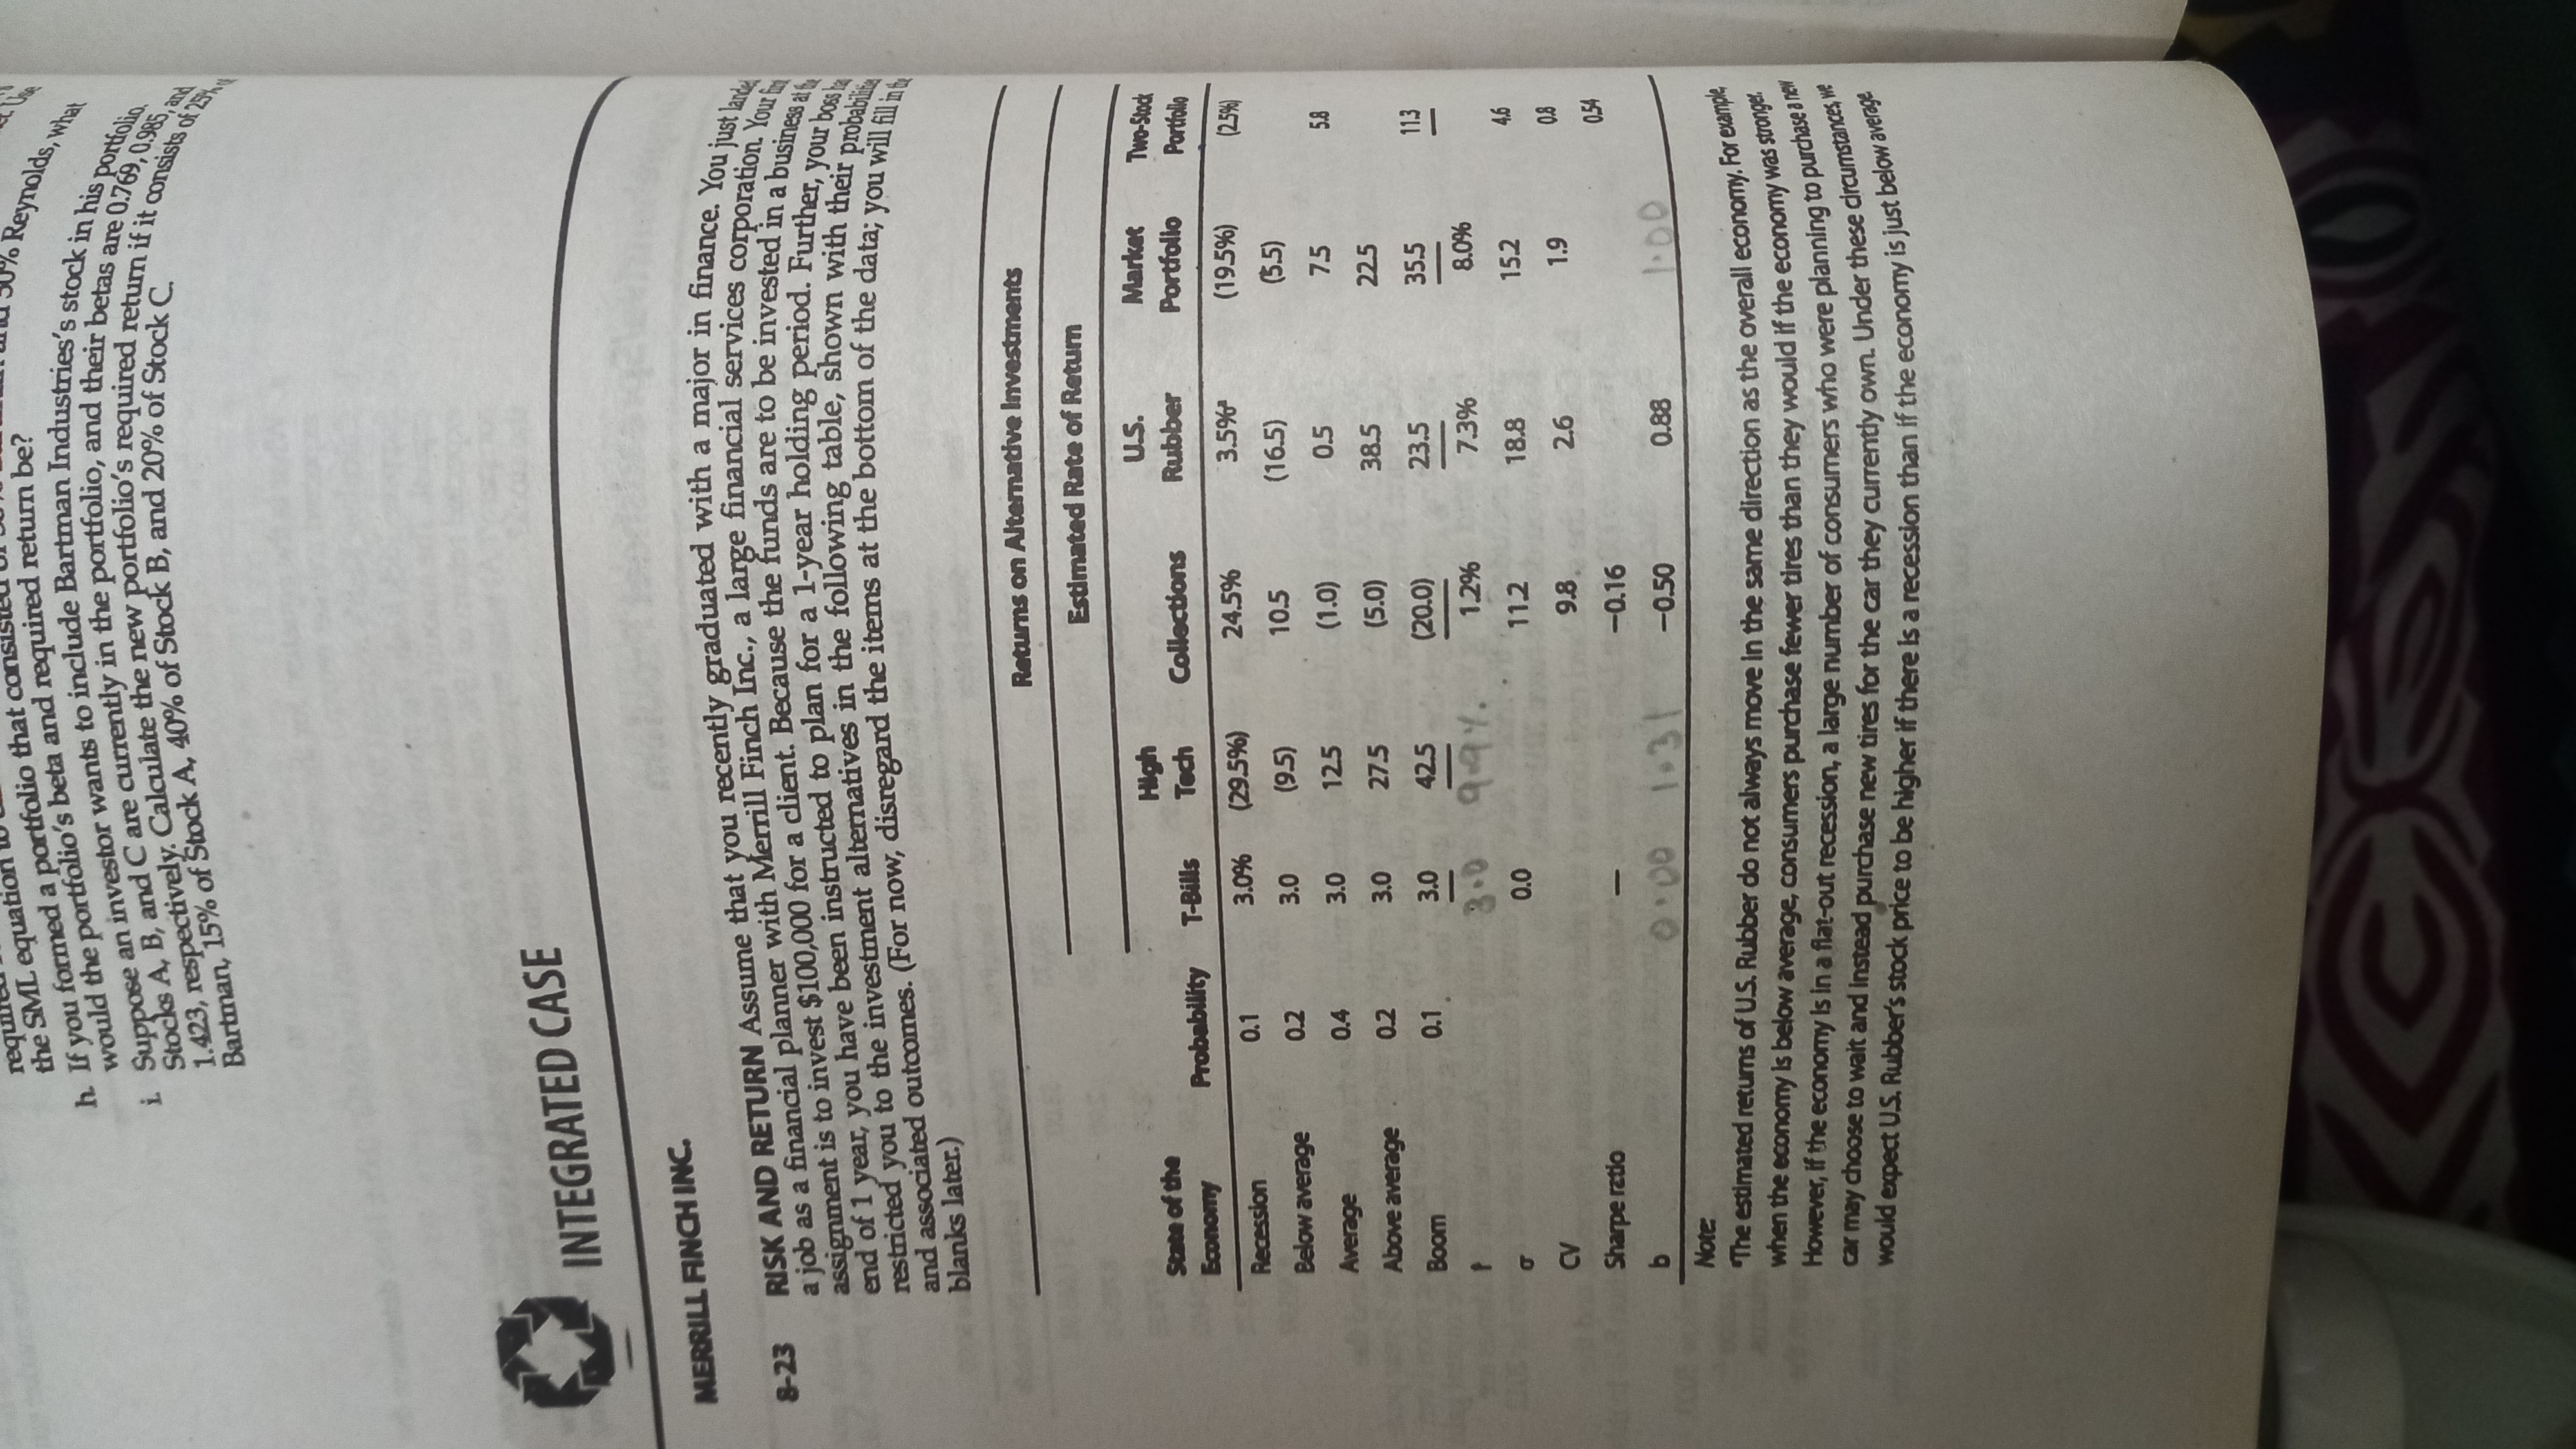
Extracted text: 百 Bartman, of Stock A, of Stock B, and 20% of C. would the beta and return be? a job as a with a Your f RISK AND RETURN that you a major in just lande end of 1 you have been to plan for a bossla assignment is to a client. the are to be in a a and (For now, the items at of you will fill it bar the SML equation h If you formed a portfolio that cons restricted you to the in the with their probablite i an to stock in his portfolio. Reynolds, what pue c86 INTEGRATED CASE MERRILL FINCH INC. 8-23 a job as a financial planner with Merrill Finch Inc., a large a restricted nou, blanks later.) Returns on Alternative Investments Estimated Rate of Retum U.S. Rubber Market State of the Probability T-Bills Collections Portfolio Portfollo AsOucog 24.5% Recession 0.1 (29.5%) (195%) 10.5 (16.5) (5.5) (5) 125 0.2 0.4 3.0 0.5 7.5 (0') Above average 0.2 3.0 27.5 38.5 225 (O'S) 0.1 42.5 23.5 35.5 113 woog 3.0 997. 1.2% 7.3% 112 18.8 15.2 00 9.8 2.6 Sharpe ratio -0.16 50 -0.50 0.88 1000 13 1.00
Jun 08, 2022
SOLUTION.PDF

Get Answer To This Question

Related Questions & Answers

More Questions »

Submit New Assignment

Copy and Paste Your Assignment Here