I have designing a program that:
a. Prompts a user to specify a colour they want to change in an image,
b. Iterates through the image and changes all pixels of that colour to
black, and
c. Displays the resultant image in a new figure window.
The image I used is an image of plastic chips called coloredChips.png. This image is an in-built image in MATLAB available through the Image Processing Toolbox.
( I have already done these parts a-c in matlab what i am asking is the questions in the images)
Thank you in advance, i will forever remeber your help.
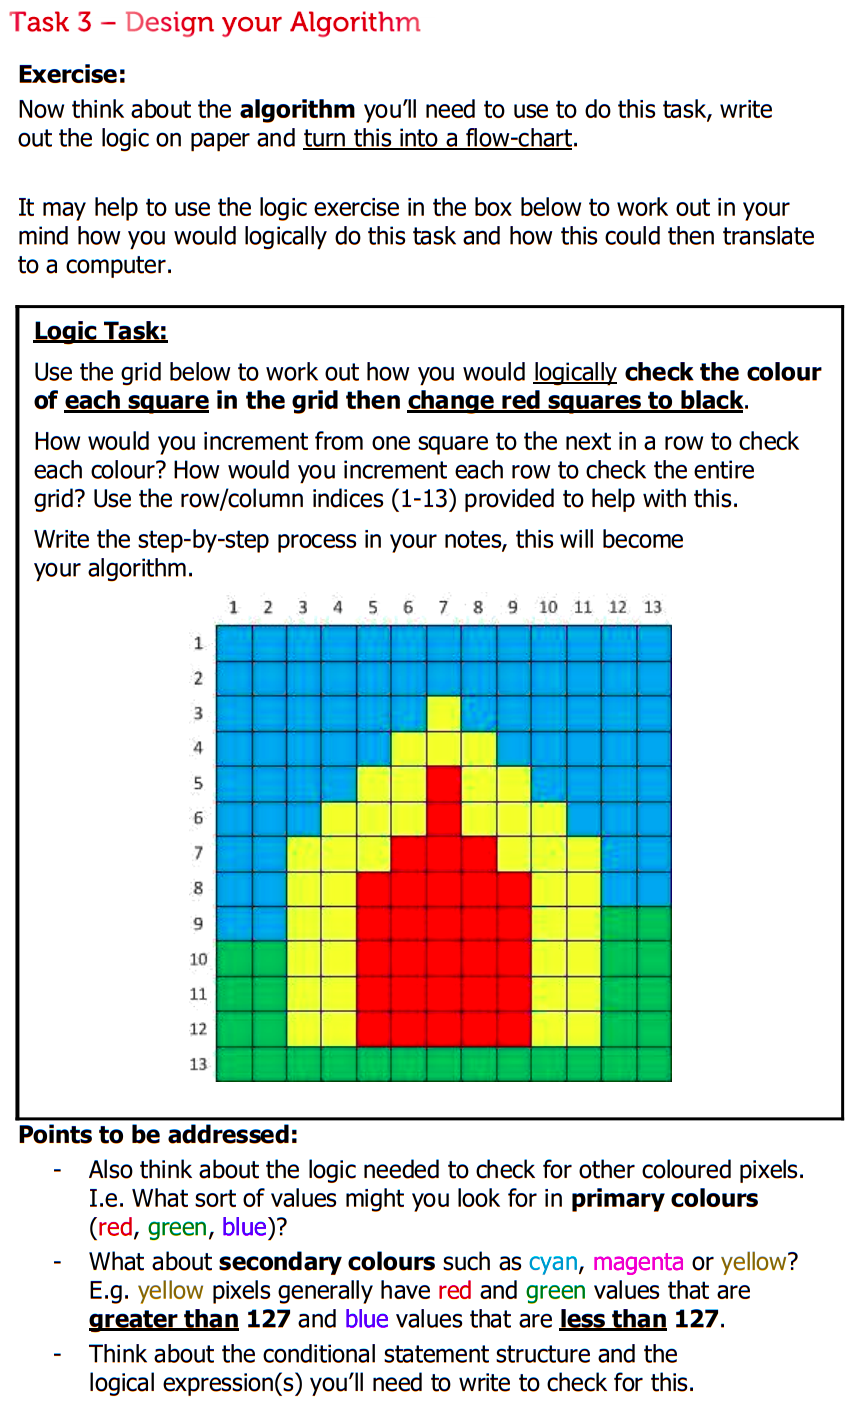
Extracted text: Task 3 – Design your Algorithm Exercise: Now think about the algorithm you'll need to use to do this task, write out the logic on paper and turn this into a flow-chart. It may help to use the logic exercise in the box below to work out in your mind how you would logically do this task and how this could then translate to a computer. Logic Task: Use the grid below to work out how you would logically check the colour of each square in the grid then change red squares to black. How would you increment from one square to the next in a row to check each colour? How would you increment each row to check the entire grid? Use the row/column indices (1-13) provided to help with this. Write the step-by-step process in your notes, this will become your algorithm. 2 4 6 7 8 9. 10 11 12 13 1 4 5. 6. 7 8. 6. 10 11 12 13 Points to be addressed: Also think about the logic needed to check for other coloured pixels. I.e. What sort of values might you look for in primary colours (red, green, blue)? What about secondary colours such as cyan, magenta or yellow? E.g. yellow pixels generally have red and green values that are greater than 127 and blue values that are less than 127. Think about the conditional statement structure and the logical expression(s) you'll need to write to check for this.
Extracted text: Task 2 – Specify your input and output data Exercise: Using the information given on the previous page determine the input you have/need to solve the problem and what you need to output to accomplish the objective. The image you'll be using for this task is 'coloredChips.png' (in the Image Processing Toolbox) so use MATLAB to import this image into your Workspace if you need so you can give details about the data-type, etc of the file. Use Table I in the appendix of this guide for the syntax for importing images. Points to be addressed: What data type is the matrix in your Workspace? What are the dimensions of the matrix shown in the Workspace? Explain what each dimension represents, especially the third dimension which will equal 3. Use the data cursor on your figure (Tools -> Data Cursor) to get an idea of the RGB values for all the different coloured chips in the image, explain how that will relate to the task you are to complete. Also think about what you will need to output to fulfil this task, (numbers, words, images, graphical output?). Describe this in detail. What assumptions are you making (if any) to help you solve/simplify the problem.