Suggest at least one method based on the Nelson-Aalen estimator that may be used to check graphically whether two hazard rates are proportional. Illustrate the method(s) using the leukemia data from
In Section 3.1.6 it is proved that, for a given value of t, the Nelson-Aalen estimator

is approximately normally distributed with mean A(t) and a variance that may be estimated by

given by (3.5).
a) Let g be a strictly increasing and continuously differentiable function. By a Taylor series expansion we have that
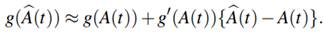
Use this to show informally that
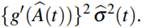
 is approximately normally distributed with mean g(A(t)) and a variance that may be estimated by
(This is a special case of the well-known delta method.)
b) Show that
 is an approximate 100(1−α)% confidence interval for g(A(t)).
By inverting the confidence interval in b) (i.e., by taking the inverse g
−1
of its lower and upper limits), we obtain an approximate 100(1 −α)% confidence interval for A(t). By a suitable choice of the transformation g, such a transformed confidence interval may have better properties for small and moderate sample sizes than the standard one given in (3.6).
c) Show that the transformation g(x) = logx
yields the log-transformed confidence interval (3.7).