Project 2: Twitter Trends
What do people tweet?
Draw their feelings on a map
to discovertrends.
Introduction
In this project, you will develop a geographic visualization of Twitter data across the USA. You will need to use dictionaries, lists, and data abstraction techniques to create a modular program. This project uses ideas from Sections2.1(외부 사이트로 연결합니다.),2.2(외부 사이트로 연결합니다.),2.3(외부 사이트로 연결합니다.), and2.4(외부 사이트로 연결합니다.), of theComposing Programs(외부 사이트로 연결합니다.)online textbook.
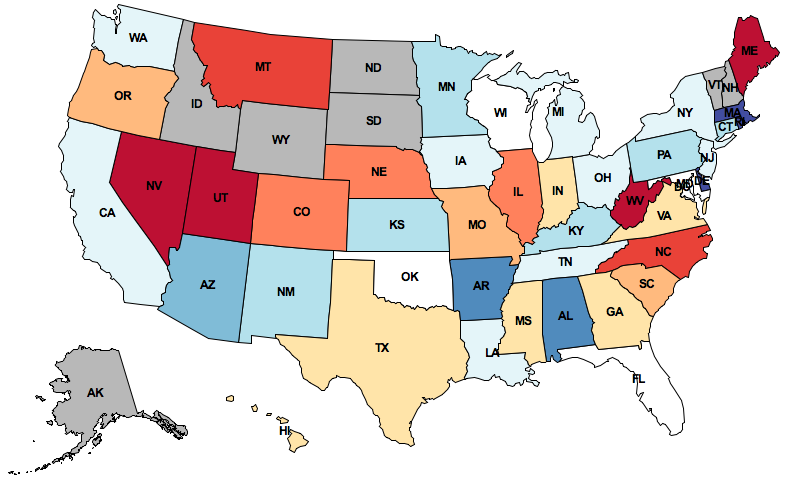
The map displayed above depicts how the people in different states feel about Texas. This image is generated by:
- Collecting public Twitter posts (tweets) that have been tagged with geographic locations and filtering for those that contain the "texas" query term,
- Assigning a sentiment (positive or negative) to each tweet, based on all of the words it contains,
- Aggregating tweets by the state with the closest geographic center, and finally
- Coloring each state according to the aggregate sentiment of its tweets. Red means positive sentiment; blue means negative.
The details of how to conduct each of these steps is contained within the project description. By the end of this project, you will be able to map the sentiment of any word or phrase. Thetrends.zip(외부 사이트로 연결합니다.)archive contains all the starter code and all data (81 MB).
The project uses several files, but all of your changes will be made to the first one.
Thedata(외부 사이트로 연결합니다.)directory contains all the data files needed for the project, and it's necessary to run the project. Thetrends.zip(외부 사이트로 연결합니다.)archive contains this directory: download it to get started. Downloading each file individually is error-prone.
Logistics
This is a one-week project. You'll work in a team of two people, and you can complete all problems together with your partner.
Start early! Feel free to ask for help early and often. The course staff is here to assist you, but we can't help everyone an hour before the deadline.Piazza(외부 사이트로 연결합니다.)awaits. You are not alone!
In the end, you and your partner will submit one project. There are 15 possible points (12 for correctness and 3 for composition). You only need to submit the file
trends.py(외부 사이트로 연결합니다.)
trends.py(외부 사이트로 연결합니다.)
submit proj2.
The Autograder
We've included an autograder which includes tests for each question. You can invoke it for a particular question number as follows:
python3 trends_grader.py -q
You can also invoke the autograder for all problems at once using:
python3 trends_grader.py
Debugging Tips
- You can use the functions
trace,interact, andlog_current_linedefined in
ucb.py(외부 사이트로 연결합니다.)
- You can load your entire implementation and then interact with the current environment using the command:
python3 -i trends.py
- Add
printcalls to your functions, but remove them before submitting your final version.
- Come to office hours or post on Piazza when you're stuck, before you get too frustrated.
Phase 1: The Feelings in Tweets
In this phase, you will create an abstract data type for tweets, split the text of a tweet into words, and calculate the amount of positive or negative feeling in a tweet.
Tweets
First, we will define an abstract data type for tweets. To ensure that we do not violate abstraction barriers later in the project, we will create two different representations:
(A) The constructormake_tweetreturns a Python dictionary with the following entries:
'text': a string, the text of the tweet, all in lowercase 'time': a datetime object, when the tweet was posted 'latitude': a floating-point number, the latitude of the tweet's location 'longitude': a floating-point number, the longitude of the tweet's location
(B) The alternate constructormake_tweet_fnreturns a function that takes a string argument that is one of the keys above and returns the corresponding value.
Problem 1(1 pt). Implement the missing selector and constructor functions for these two representations:tweet_text,tweet_time,tweet_locationcorrespond to representation (A);make_tweet_fncorresponds to representation(B). Fortweet_locationyou should return apositionobject. The constructors and selectors for this abstract data type can be found ingeo.py. Remember to preserve data abstraction!
The two representations created bymake_tweetandmake_tweet_fndo not need to work together, but each constructor should work with its corresponding selectors. The doctests formake_tweetandmake_tweet_fnensure that this is the case. They can be run along with other tests using:
python3 trends_grader.py -q 1
Next, we will retrieve the words from a tweet and compute their sentiment.
Problem 2(2 pt). Improve theextract_wordsfunction as follows: Assume that a word is any consecutive substring oftextthat consists only of ASCII letters. The stringascii_lettersin thestringmodule contains all letters in the ASCII character set. Theextract_wordsfunction should list all such words in order and nothing else.
When you complete this problem, tests for question 2 should pass:
python3 trends_grader.py -q 2
Problem 3(1 pt). Implement thesentimentabstract data type, which represents a sentiment value that may or may not exist. The constructormake_sentimenttakes either a numeric value within the interval -1 to 1, orNoneto indicate that the value does not exist. Implement the selectorshas_sentimentandsentiment_valueas well.You may use any representation you choose, but the rest of your program should not depend on this representation.
When you complete this problem, the question 3 tests should pass:
python3 trends_grader.py -q 3
You can also call theprint_sentimentfunction to print the sentiment values of all sentiment-carrying words in a line of text.
python3 trends.py -p computer science is my favorite! python3 trends.py -p life without lambda: awful or awesome?
Problem 4(1 pt). Implementanalyze_tweet_sentiment, which takes a tweet (of the abstract data type) and returns asentiment. Read the docstrings forget_word_sentimentandanalyze_tweet_sentimentin
trends.py(외부 사이트로 연결합니다.)
Thetweet_wordsfunction should prove useful here: it combines thetweet_textselector andextract_wordsfunction from the previous questions to return a list of words in a tweet.
When you complete this problem, the question 4 tests should pass:
python3 trends_grader.py -q 4
Phase 2: The Geometry of Maps
In this phase, we will implement two functions that together determine the centers of U.S. states. The shape of a state is represented as a list of polygons. Some states (e.g. Hawaii) consist of multiple polygons, but most states (e.g. Colorado) consist of only one polygon (still represented as a length-one list).
We will use the position abstract data type to represent geographic latitude-longitude positions on the Earth. The data abstraction, defined at the top of
geo.py(외부 사이트로 연결합니다.)
make_positionand the selectorslatitudeandlongitude.
Problem 5(2 pt). Implementfind_centroid, which takes a polygon and returns three values: the coordinates of its centroid and its area. The input polygon is represented as a list ofpositionvalues that are consecutive vertices of its perimeter. The first vertex is always identical to the last.
The centroid of a two-dimensional shape is its center of balance, defined as the intersection of all straight lines that evenly divide the shape into equal-area halves.find_centroidreturns the centroid and area of an individual polygon.
The formula for computing thecentroid of a polygon(외부 사이트로 연결합니다.)appears on Wikipedia. The formula relies on vertices being consecutive (either clockwise or counterclockwise; both give the same answer), a property that you may assume always holds for the input.
Hint: latitudes correspond to thexvalues, and longitudes correspond to theyvalues.
The area of a polygon is never negative. Depending on how you compute the area, you may need to use the built-inabsfunction to return a non-negative number.
Manipulate positions using their selectors (latitudeandlongitude) rather than assuming a particular representation.
When you complete this problem, the question 5 tests should pass:
python3 trends_grader.py -q 5
Problem 6(1 pt). Implementfind_state_center, which takes a state represented by a list of polygons and returns a positionobject, its centroid.
The centroid of a collection of polygons can be computed bygeometric decomposition(외부 사이트로 연결합니다.). The centroid of a shape is the weighted average of the centroids of its component polygons, weighted by their area.
When you complete this problem, the question 6 tests should pass:
python3 trends_grader.py -q 6
Once you are finished,draw_centered_mapwill draw the10states closest to a given state (including that state). A red dot should appear over the two-letter postal code of the specified state.
python3 trends.py -d CA
Your program should work identically, even if you use the functional representation for tweets defined in question 1, using the -f flag.
python3 trends.py -f -d CA
Phase 3: The Mood of the Nation
In this phase, you will group tweets by their nearest state center and calculate the average positive or negative feeling in all the tweets associated with a state.
The nameus_statesis bound to a dictionary containing the shape of each U.S. state, keyed by its two-letter postal code. You can use the keys of this dictionary to iterate over all the U.S. states.
Problem 7(2 pt). Implementgroup_tweets_by_state, which takes a sequence of tweets and returns a dictionary. The keys of the returned dictionary are state names (two-letter postal codes), and the values are lists of tweets that appear closer to that state's center than any other.
You should not include any states as keys that are not nearest to any tweet. You may want to define additional functions to organize your implementation into modular components. You will need to use the dictionary ofus_statesdescribed above.
When you complete this problem, the question 7 tests should pass:
python3 trends_grader.py -q 7
Problem 8(2 pt). Implementaverage_sentiments. This function takes the dictionary returned bygroup_tweets_by_stateand also returns a dictionary. The keys of the returned dictionary are the state names (two-letter postal codes), and the values are average sentiment values for all the tweetsthat have sentiment valuein that state.
If a state has no tweets with sentiment values, leave it out of the returned dictionary entirely. Do not include a state with no sentiment using a zero sentiment value. Zero represents neutral sentiment, not unknown sentiment. States with unknown sentiment will appear gray, while states with neutral sentiment will appear white.
When you complete this problem, the question 8 tests should pass:
python3 trends_grader.py -q 8
You should now be able to draw maps that are colored by sentiment corresponding to tweets that contain a given term. The correct map for Texas appears at the top of this page.
python3 trends.py -m texas python3 trends.py -m sandwich python3 trends.py -m obama python3 trends.py -m my life
Your program should work identically, even if you use the functional representation for tweets defined in question 1, using the -f flag.
python3 trends.py -f -m texas
Congratulations!One more 61A project completed.
Extensions
These extensions are optional and ungraded. In this class, you are welcome to program just for fun. If you build something interesting, come to office hours and give us a demo. However, please do not change the behavior or signature of the functions you have already implemented.
- Implement a function
draw_map_by_hourthat visualizes the tweets that were posted during each hour of the day. For example, you'll discover that "sandwich" tweets appear most positive at 10:00pm: late night snack!
- Punctuation can be an indicator of sentiment as well. Add an emoticon (smiley) detector that attributes positive sentiment to happy faces
:-)and negative sentiment to sad ones.
- In the standard implementation, some tweets are associated with different states than the ones in which they occurred. For example, all tweets from Manhattan are assigned to New Jersey. New Yorkers would be appalled! Write a function
find_containing_statethat finds the state that actually contains a tweet position.
- The
graphics.py(외부 사이트로 연결합니다.)
slide_shapemethod to have states and dots slide into place.
Correct the spelling(외부 사이트로 연결합니다.)of tweets before you compute their sentiment.
- Calculate the total average sentiment of the whole country for a term and display that using the map.py and graphics.py package (try and understand the implementation of draw_most_talkative_states then use it as a foundation and modify as needed)
Acknowledgements:Aditi Muralidharan developed this project with John DeNero. Hamilton Nguyen extended it. Keegan Mann developed the autograder. Many others have contributed as well.
Submission:
- Submit yourtrends.py
Take the screenshots of the code and the test runs for every problem. Submit the screenshots in the below form.
Project Submission Form(https://docs.google.com/document/d/1YG_w-u5qdrQ9CGdP6LAYu9NzRKkVA496UFDVdzBdYi0/edit)
data(
http://inst.eecs.berkeley.edu/~cs61a/fa13/proj/trends/data/)correct the spelling(
http://norvig.com/spell-correct.html)